by Leadership Connect Data Science Team, Michael Crosby, Jennifer Meas, and Salma Ismaiel
October 2022
Congress had a recent win with the re-authorization of the Small Business Administration’s Small Business Innovation Research (SBIR) program. Although there have been criticisms of its overall success, the SBA claims over 70,000 patents and 700 public companies have resulted from the program. In our recent study, we took an impartial look at the data behind the SBIR program focusing on four key audiences that contribute to the success.
OVERALL FINDINGS
- The SBIR program tech initiatives are 16% more successful than venture capital for tech startup programs. This compares a 14% success rate within the SBIR program to 12% for venture capital (TechCrunch).
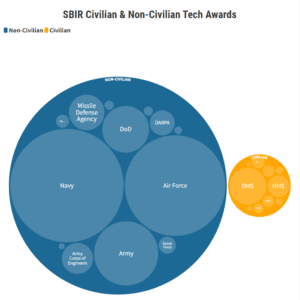
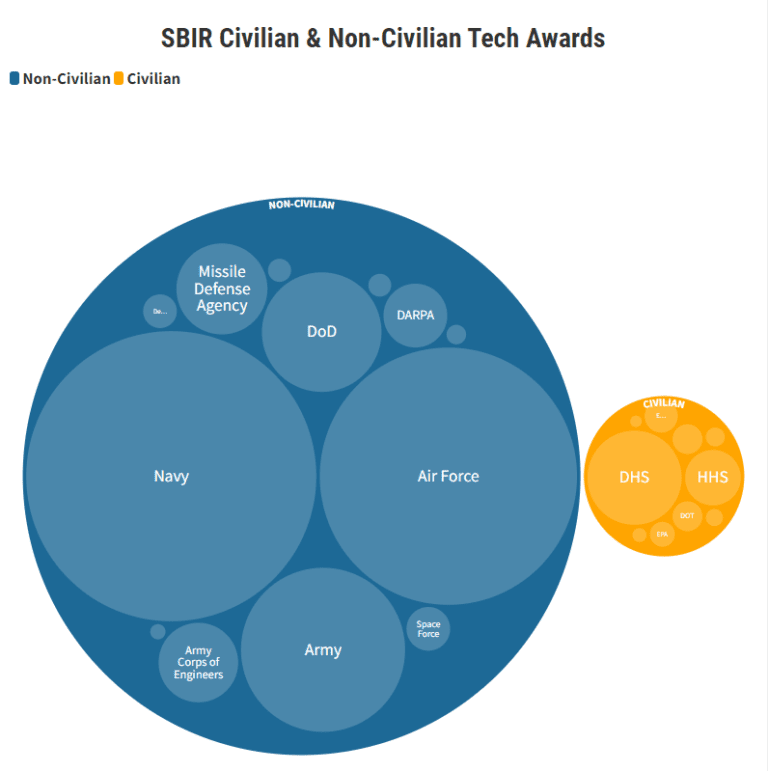
- The majority of the $10B in awards we analyzed within the SBIR program were made within the Department of Defense, coming out of several offices across the Air Force, Army, & Navy.
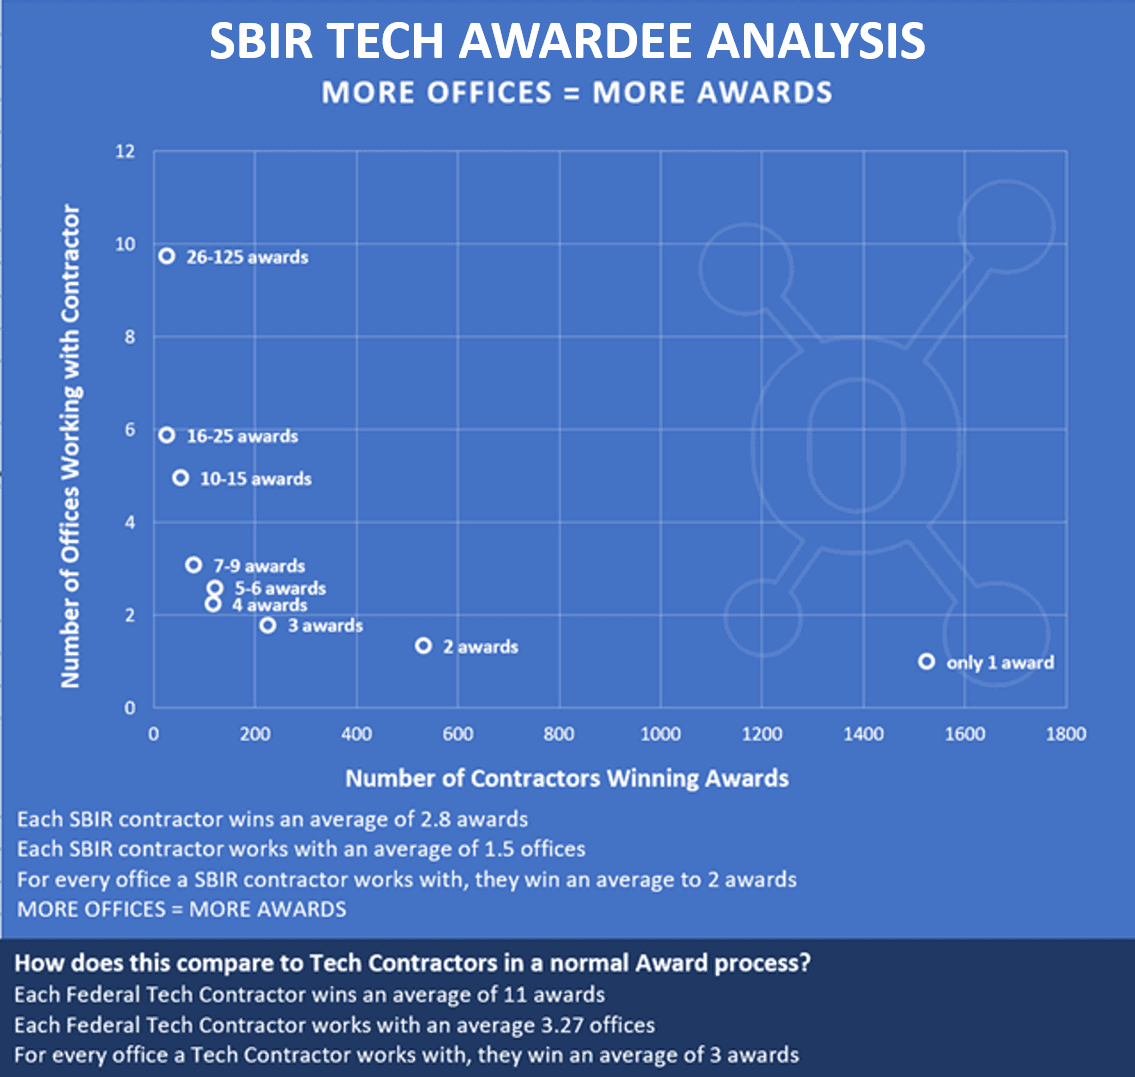
- SBIR awardees become more successful by working with multiple offices within the federal government. Awardees in Phase I and Phase II build relationships with multiple offices before starting Phrase III, allowing them to work with more than one office exclusively.
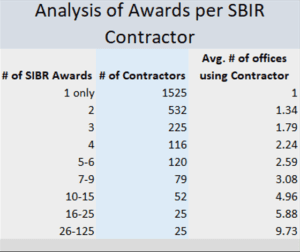
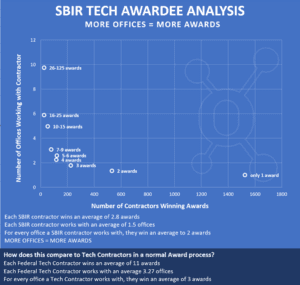
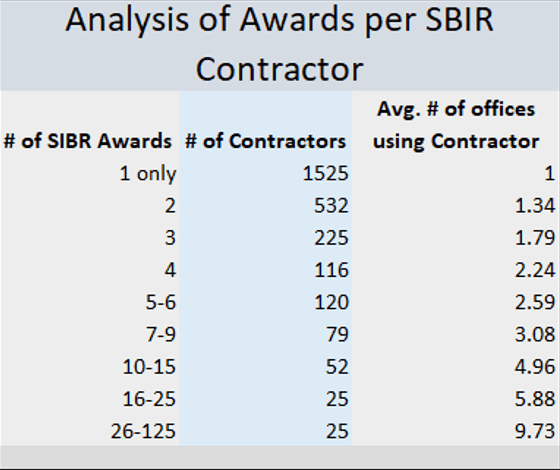
- SBIR awardees average two awards per office. As an example, a recipient with ten awards is likely to have worked with five offices.
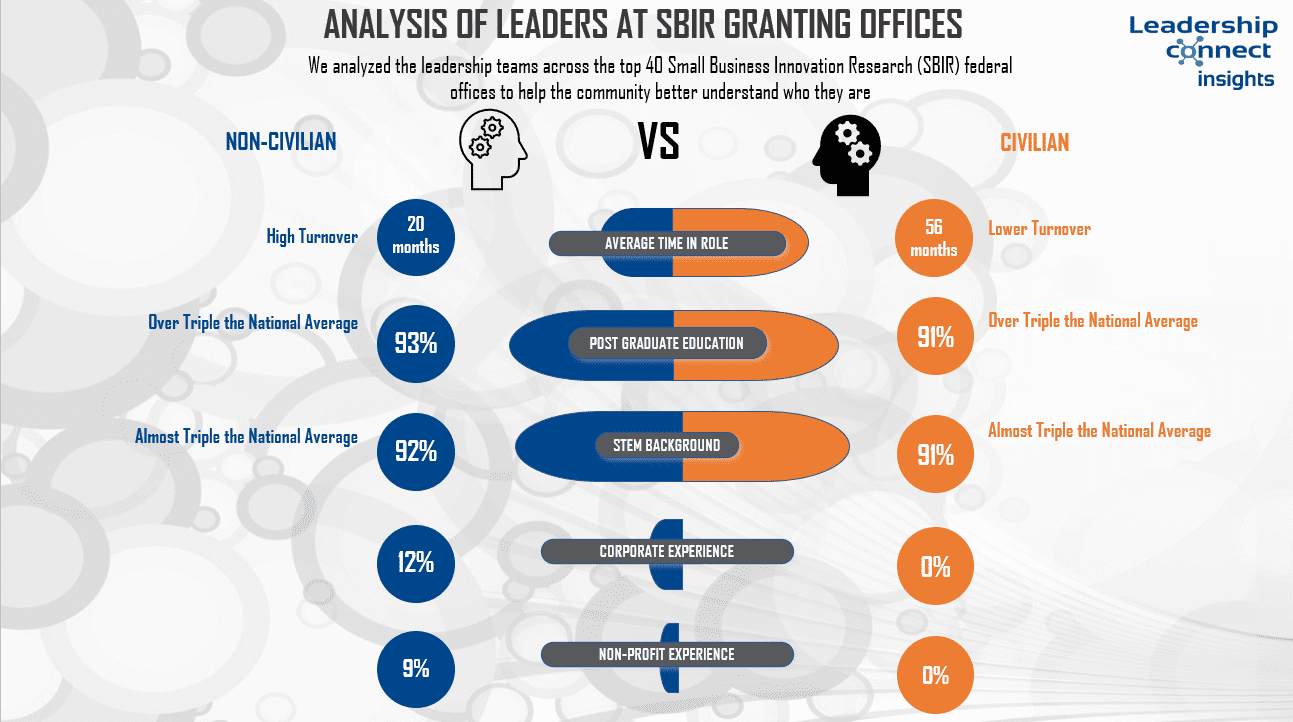
- There is academic unity among leaders awarding SBIR contracts. In the data we reviewed, 90% of leaders have a post-graduate degree, overwhelmingly in STEM.
- Civilian leaders last over 4-years, but non-civilian leaders stay for 20-months on average within the 40 offices evaluated.
WHAT WE KNOW ABOUT KEY DECISION-MAKERS
We have evaluated two types of decision-makers, civilian and non-civilian, who play an integral role in SBIR’s award allocation. From our assessment, we’ve determined that longer tenure and involvement with the phases of SBIR programs results in a greater level of success.
Since leader turnover is lower across civilian agencies, success in this program is directly linked to forming deeper relationships with them due to their expertise and longevity. Our evaluation provides background on those leaders.
Key Findings
- Of the leaders in offices using the SBIR program, 91% have a STEM background and 93% have at least 1 post-grad degree.
- Non-civilian leaders spend an average of 20-months in-role meaning SBIR recipients need to build larger networks to be successful. They cannot rely on one person.
- Civilian leaders spend 56-months in role.
- Civilian leaders have not worked in the private, nor non-profit sectors.
- For non-civilian, 12% have worked in the private sector and 9% in non-profit.
The bottom line is that SBIR awardees need to work hard to understand the leaders’ missions, challenges, and approaches to those challenges
AGENCY RELATIONSHIPS AND AWARDEE SUCCESS
Sustained relationships with decision-makers across agencies allow contractors greater opportunities for phase completion
Key Findings
- If getting to Phase III is a proxy for success, the number of contractors making it to Phase III is at a higher rate than contracts in venture capital programs. It is worth committing energy to this program.
- When leaders in federal agencies see awardees they want to work with, they are referring them to other parts of the org. For instance, all of one contractor’s deals can be within the Air Force but come out of several offices within the agency.
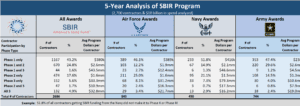
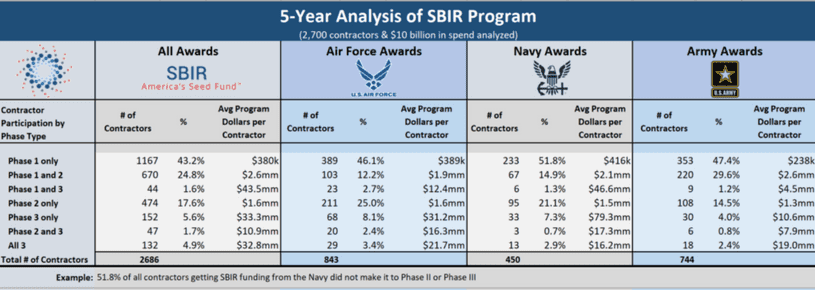
All Awards
- Phase 1 & Done’s average $380k in value
- Any awardee with Phase 3 average over $10mm
Air Force Awards
- Phase 2/3’s slightly above Navy
- Phase 1 and dones similar to other branches
Navy Awards
- Phase 1 & Done’s above average
- Value of Phase 3’s above average
Army Awards
- Value of Phase 1’s below average
- Awardees making it to Phase 3 below average
The majority of the $10B in awards we analyzed within the SBIR program were made within the Department of Defense, coming out of several offices across Air Force, Army, & Navy.
Key Findings
Average number of SBIR awards per recipient: 2.8 vs. 11 for all tech awardees
Average number of offices with whom each office works: 1.5 vs. 3.3 for all tech awardees
Observation: for every office a SBIR awardee is successful with, they average 2 awards
Recommendation: SBIR awardees need to build more relationships with offices they are not working with currently
AWARD KEYWORD SEARCHES
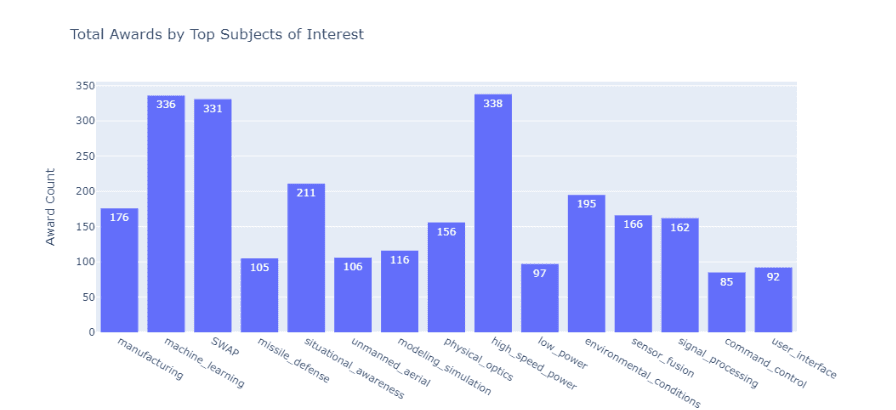
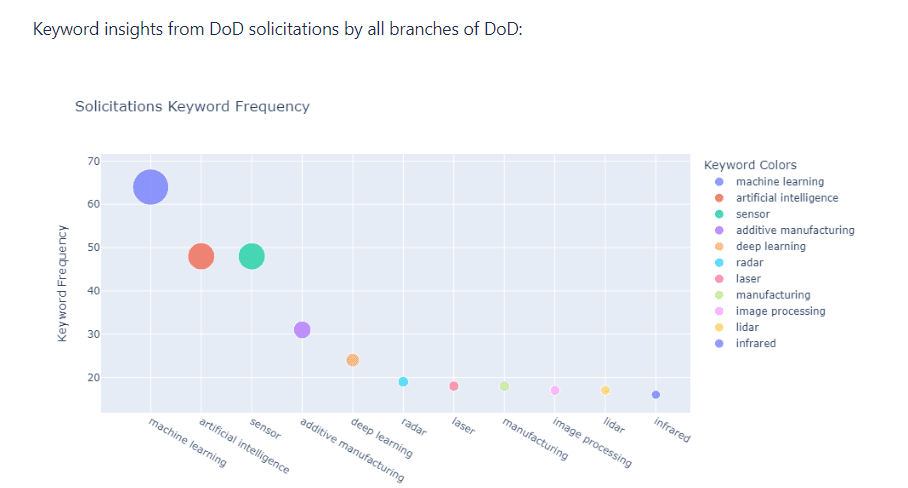
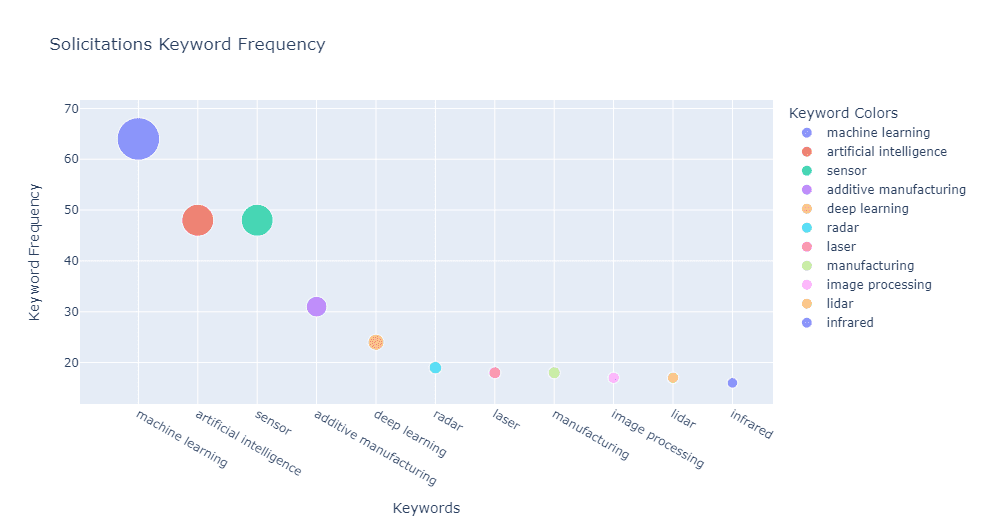
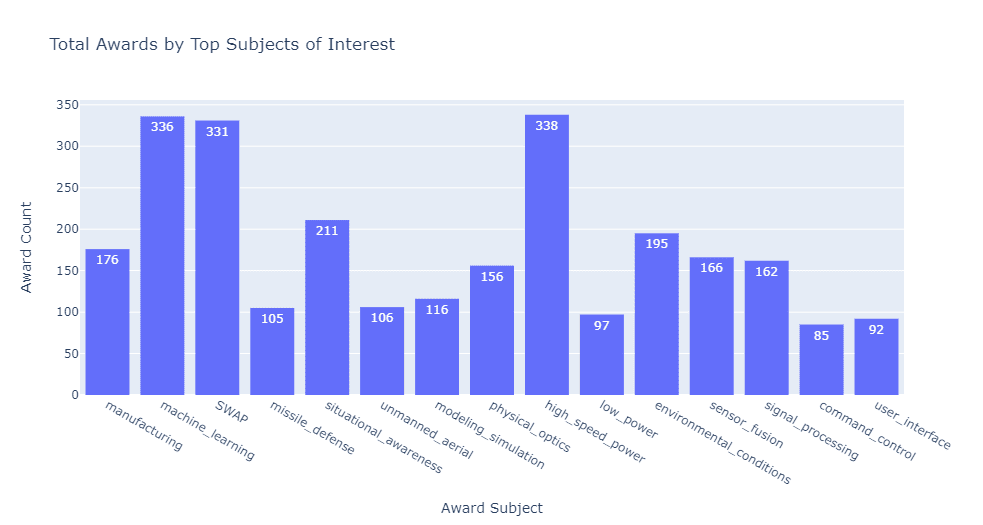
The Department of Defense (DoD) had 9,206 keyword specific solicitations. When awardees determine where to place bids, they often do so through these keyword searches. Our findings show that technological development keywords show the highest searches.
Top solicitations keywords by top DoD branches (count):
{‘Army’: {‘artificial intelligence’: 26, ‘machine learning’: 26},
‘Navy’: {‘systems integrators’: 8},
‘Air Force’: {‘sensor’: 19},
‘Defense Logistics Agency’: {‘subsystems’: 10},
‘Missile Defense Agency’: {‘additive manufacturing’: 3, ‘fiber amplifiers’: 3, ‘high power fiber lasers’: 3, ‘manufacturing’: 3, ‘sensor’: 3, ‘thermal protection system’: 3},
‘Defense Health Program’: {‘amr’: 3, ‘eskape’: 3, ‘machine learning’: 3, ‘wound infections’: 3},
‘National Geospatial-Intelligence Agency’: {‘machine learning’: 13}}
Methodology: we analyzed 5-years of SBIR awards using Leadership Connect. We excluded non-tech awards, by NAICS code, covering such items as office expenses. Two NAICS codes dominated “tech” awards (78% of the total) – 541715 (R&D) and 541511 (Computer Programming). 518210, 541330 and 541512 comprised 1/8 of the value of all tech awards analyzed.
When using on average throughout this report, it is in reference to the averages across our analysis of the top 40 SBIR offices.
Share on social media:


